
A (Practical) Framework for Quantifying Cyber Risk: Part 3
Introduction
In Part 2, I promised to show you how to run Monte Carlo simulations for FAIR risk analysis. But here's the thing: after spending weeks helping clients quantify their cyber risks, I realized that while Excel works, it's not ideal for the dynamic, collaborative nature of vCISO engagements.
So instead of just showing you spreadsheet formulas, I've built something better: an interactive Monte Carlo simulation tool designed explicitly for FAIR-based risk quantification. And I'm making it freely available to the cybersecurity community.
In this article, I'll explain what this tool is, why it matters to your practice, and how it can transform how you communicate risk to business stakeholders.
The Problem with Traditional Approaches
Let me paint you a familiar picture. You're in a board meeting, presenting your risk assessment. You've done the math, calculated the ALE, and prepared your slides. Then someone asks:
"But what if our email security is better than you assumed?" "How much would we save if we invested in EDR?" "What's the worst-case scenario we should prepare for?"
With a static Excel model, you're stuck. You can't adjust parameters on the fly. You can't show them the impact of different investment scenarios in real-time. You end up saying "I'll run the numbers and get back to you" — and the momentum is lost.
This is precisely the problem I set out to solve.
Introducing the FAIR Monte Carlo Simulation Tool
The tool I've developed provides two complementary approaches to FAIR risk quantification:
1. An Interactive Web Dashboard: Think of this as your "client presentation mode." It's a browser-based interface where you can:
Adjust threat frequency, vulnerability, and loss magnitude parameters using intuitive sliders
Run 10,000+ Monte Carlo simulations with a single click
See interactive charts update in real-time as you change parameters
Calculate Return on Security Investment (ROSI) on the fly during discussions
Export professional reports instantly
2. Python Command-Line Scripts: For the technical practitioners who need automation, batch processing, or integration into existing workflows. Perfect for:
Running monthly risk reports for multiple clients
Conducting sensitivity analysis across parameter ranges
Integrating FAIR calculations into your existing risk management tools
Generating reproducible, version-controlled risk assessments

Output of the Python script in PNG format
Both approaches use the same simulation engine under the hood, giving you consistent results whether you're presenting to a board or automating your monthly reporting.
Why This Matters for Your Practice
Client Engagement Transforms Overnight
Instead of presenting static numbers, you collaborate with clients to explore their risk landscape together. During a recent vCISO engagement, I used the dashboard to show a client the impact of phishing training. We adjusted the "Probability of Action" slider from 15% to 5% in real-time and watched their ALE drop from €620,000 to €210,000. That visual demonstration — happening during the conversation — led to immediate budget approval for the training program.
Traditional approach: "Based on my analysis, training will reduce risk by approximately 65%." Interactive approach: "Let me show you exactly what happens when we reduce successful phishing clicks..." [adjusts slider] "See? Your risk drops from €620k to €210k annually."
The difference in engagement is night and day.
Probabilistic Thinking Becomes Accessible
One of FAIR's greatest strengths is its acknowledgment of uncertainty through probability distributions. But explaining PERT distributions and percentiles to non-technical stakeholders can be challenging.
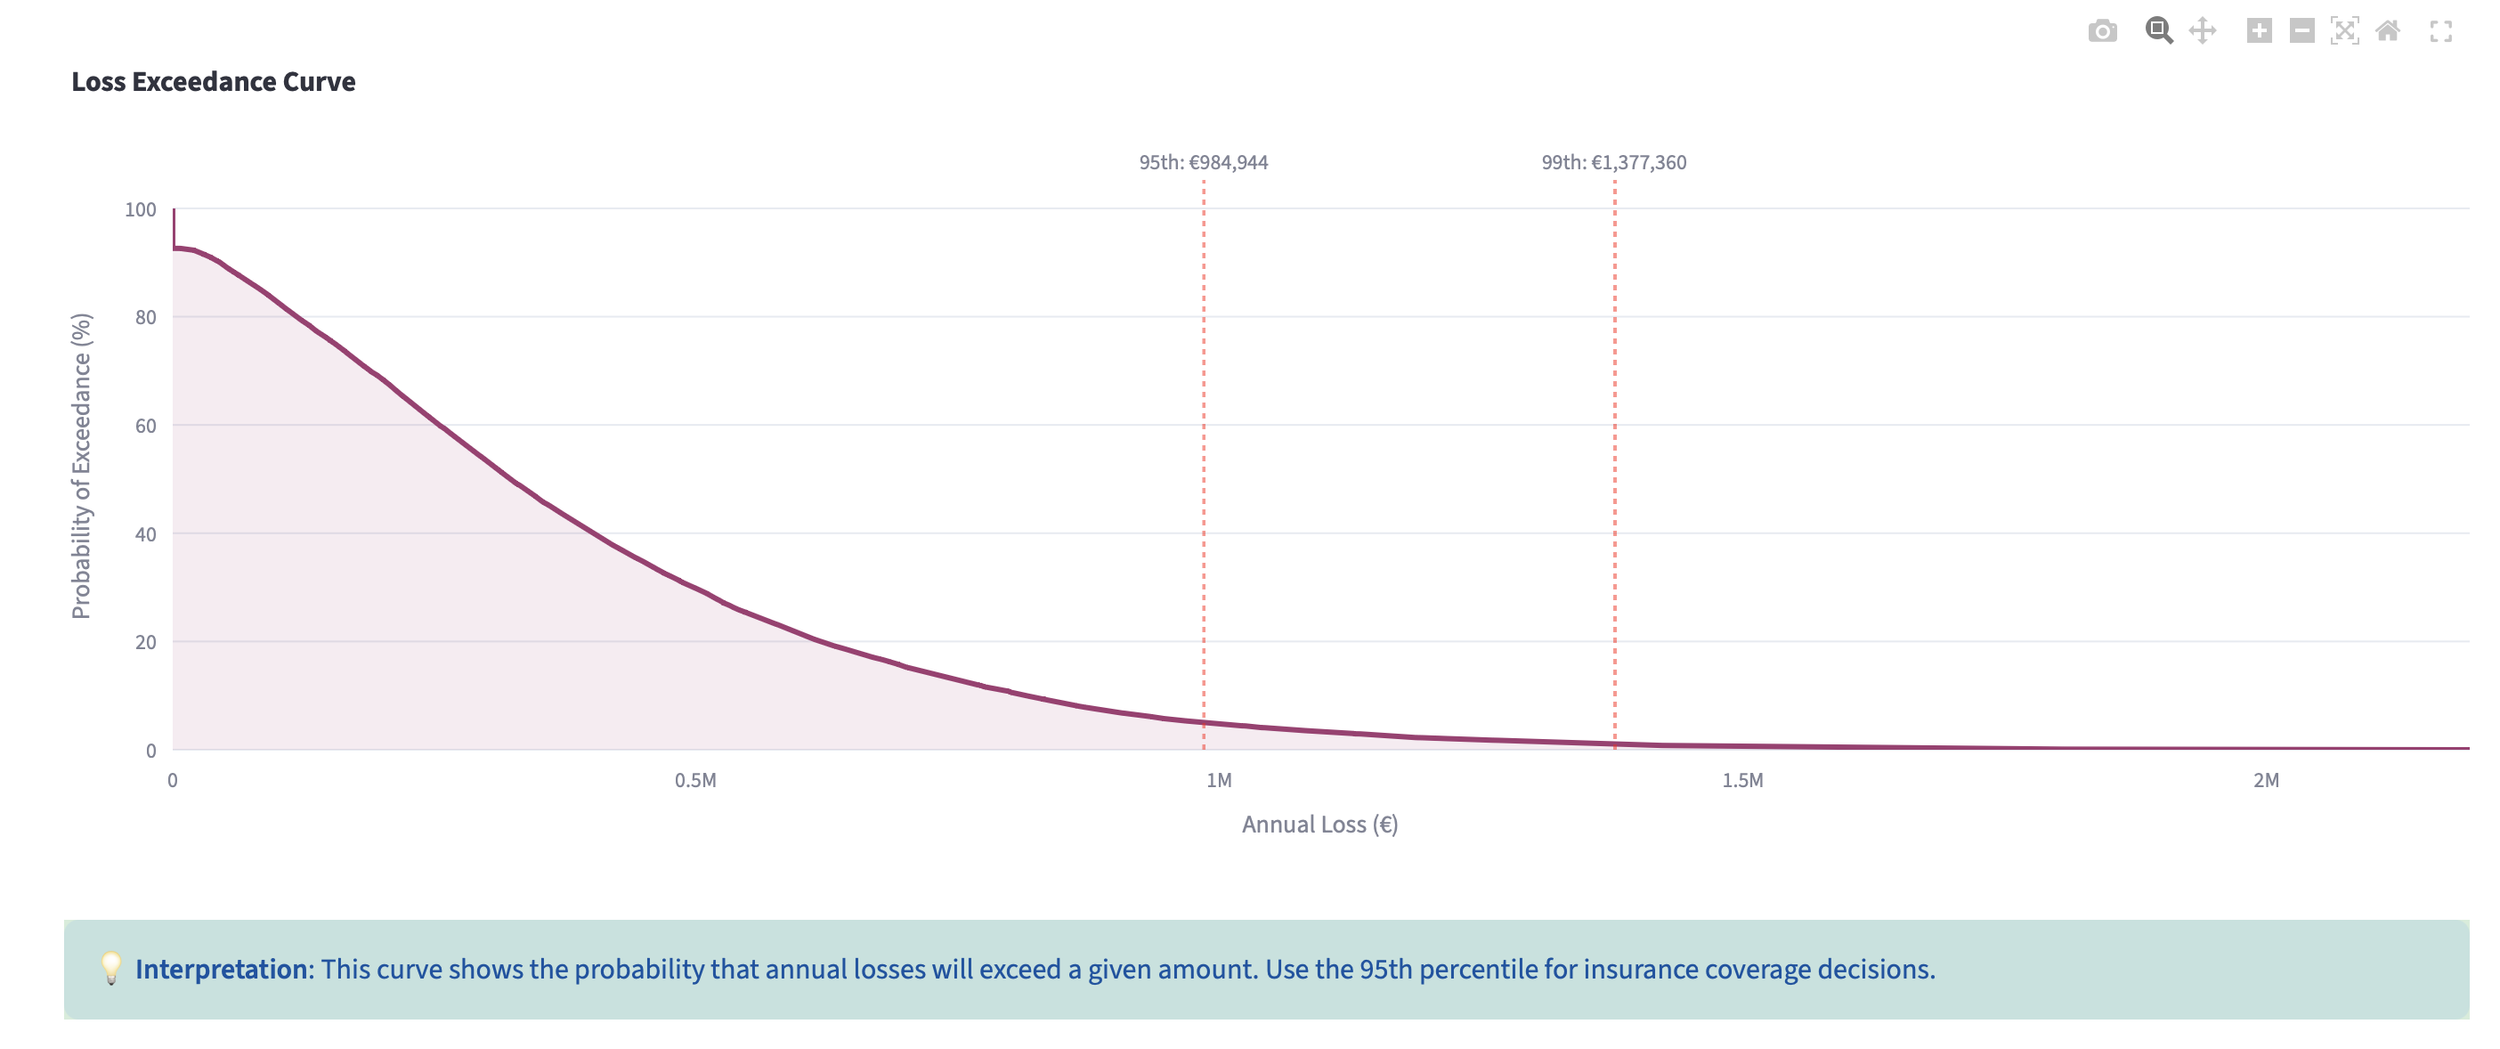
The interactive dashboard makes this intuitive. Clients see the distribution curve and the exceedance probability, and immediately understand that risk isn't a single number — it's a range of possibilities. The 95th percentile becomes "your worst-case planning number" rather than a statistical abstraction.
ROSI Calculations Become Collaborative
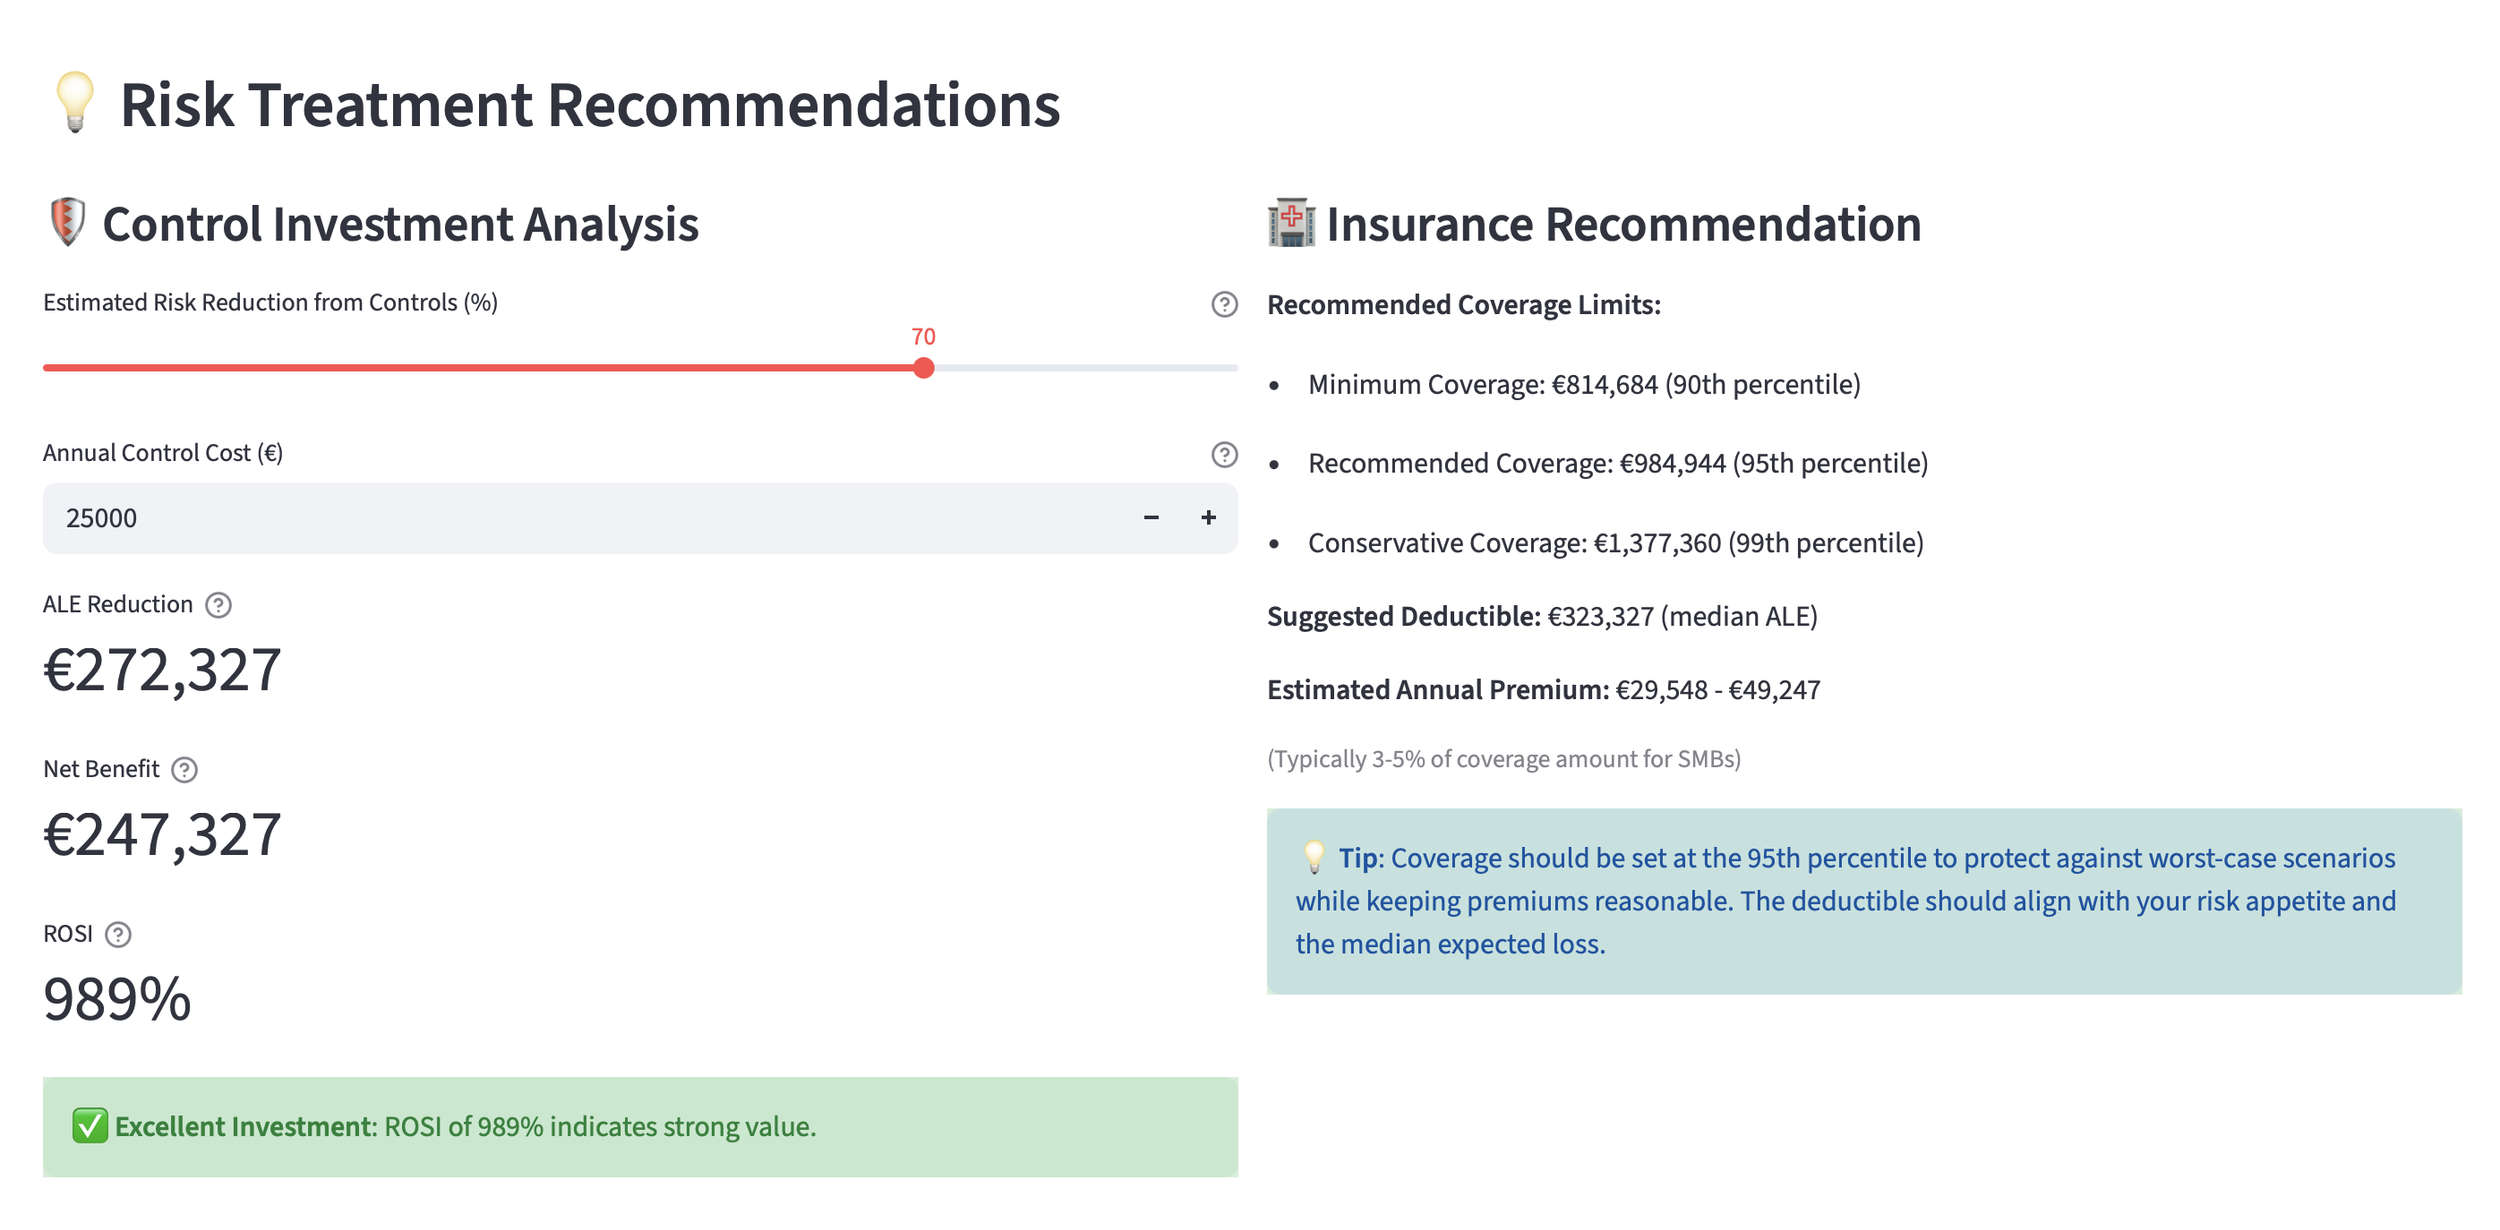
The dashboard includes a built-in control investment analyzer. You input the proposed security control cost and estimated risk reduction, and it calculates:
ALE reduction in euros
Net benefit after control costs
Return on Security Investment percentage
When a client pushes back on a €50,000 EDR/MDR investment, you show them it would reduce ALE by €430,000, yielding a 760% ROSI. The conversation shifts from "that's expensive" to "how quickly can we implement this?"
Compliance Documentation Becomes Effortless
For ISO 27001, SOC 2, NIS2, or DORA compliance, you need documented, defensible risk assessments. The tool exports:
Complete simulation data (CSV with all 10,000 iterations)
Summary statistics (JSON format)
Executive-friendly reports (formatted text)
Publication-ready charts (See the PNG image in the article)

Everything is timestamped, parameter-documented, and audit-ready. Your risk assessment suddenly goes from "educated guesswork" to "mathematically rigorous analysis backed by industry data."
Industry Benchmarks Are Built-In
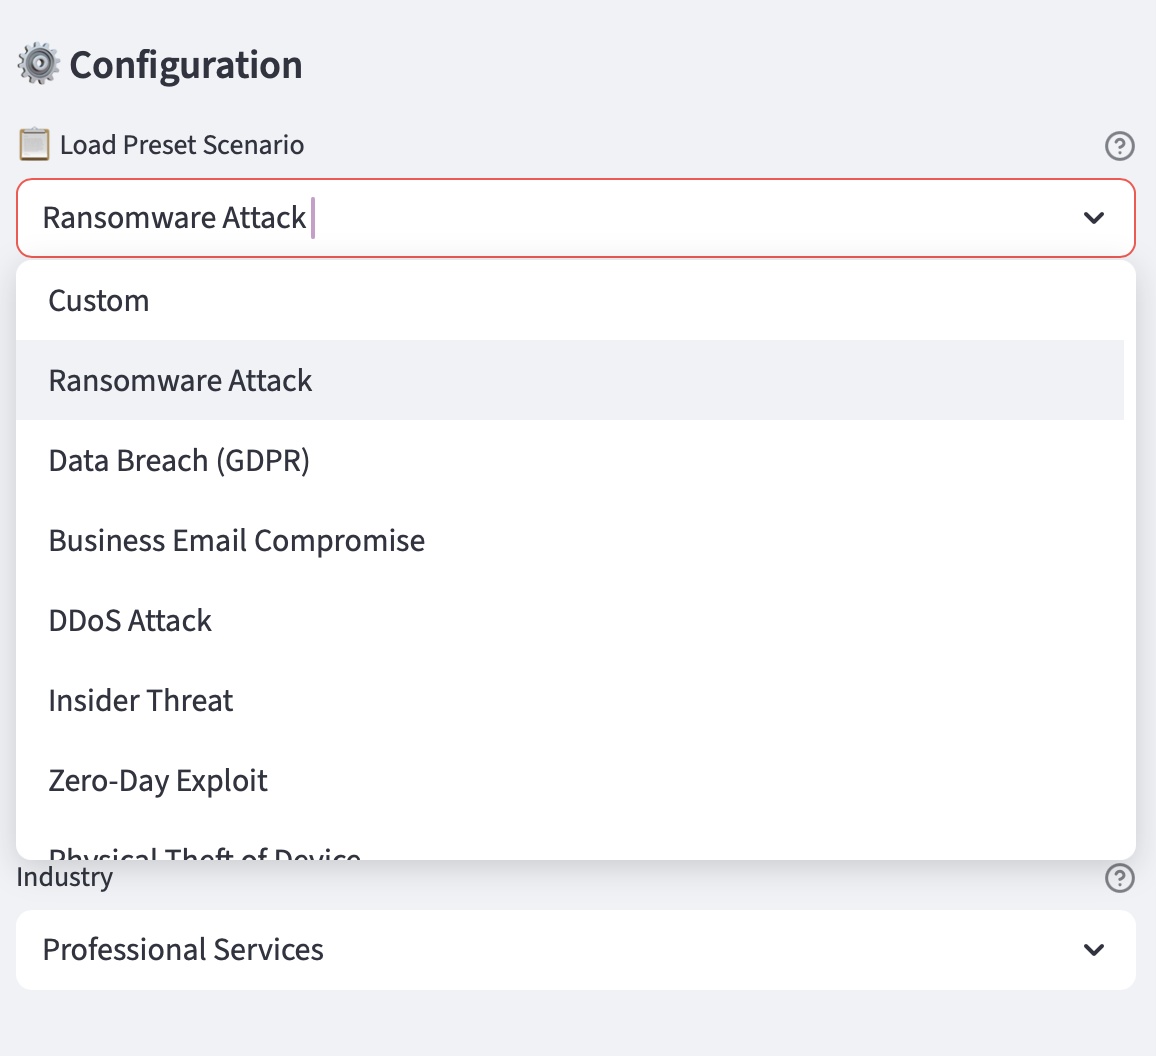
The tool comes with preset scenarios based on current European SMB threat landscape data:
Ransomware attacks (using Sophos and Verizon DBIR data)
Data breaches (GDPR-focused with EU fine statistics)
Business Email Compromise (FBI IC3 loss data)
DDoS attacks (sector-specific frequency rates)
Insider threats (Verizon DBIR insider action statistics)
Each preset includes calibrated parameters for different company sizes (micro, small, medium enterprises) and considers EU-specific regulatory contexts. No more starting from scratch — you begin with research-backed baselines and adjust for client specifics.
Real-World Application: A Case Study
Let me share how I used this tool with a Dutch fintech startup (annual revenue €8M, 45 employees) that was concerned about ransomware risk.
Initial Assessment (15 minutes):
Selected "Ransomware Attack" preset
Adjusted for their strong backup posture (vulnerability down to 0.8%)
Adjusted for their startup status (lower secondary loss probability)
Ran simulation: Mean ALE of €156,000 (1.95% of revenue)
Risk Appetite Check: The dashboard flagged this as HIGH RISK (>1% of revenue). Their risk appetite was 0.8% of revenue, so immediate action was needed.
Treatment Analysis (10 minutes): We explored three scenarios live:
Email Security + Training: 70% risk reduction, €25k annual cost → ROSI: 334%
EDR/MDR Solution: 60% risk reduction, €40k annual cost → ROSI: 134%
Combined Approach: 85% risk reduction, €55k annual cost → ROSI: 141%
Outcome: The client immediately approved the combined approach. The total meeting time was under 45 minutes, and they left with the reports exported and ready for their board. Three months later, their internal audit praised the "rigorous quantitative approach to risk management."
Without the tool, this would have taken multiple meetings, back-and-forth emails, and several rounds of Excel. The dynamic, collaborative analysis closed the deal in a single session.
What This Means for the Broader Community
I've spent the past months refining this methodology with clients across the Netherlands, Switzerland, and Belgium. The feedback has been consistent: quantitative risk analysis transforms conversations with non-technical stakeholders.
But here's what concerns me: most SMEs and startups can't afford enterprise risk quantification platforms like RiskLens or CyberStrong (which can cost €50,000+ annually). They're stuck with qualitative heat maps that don't help them make informed investment decisions.
By making this tool freely available, I hope to:
Democratize Risk Quantification: Every vCISO, security consultant, or in-house CISO should have access to these capabilities
Raise the Bar: When more practitioners use quantitative methods, the entire industry elevates its standards
Support the SME Community: European SMEs face the same threats as enterprises but with a fraction of the budget — they deserve better tools
Advance FAIR Adoption: The methodology is excellent, but practical implementation tools are scarce
Technical Foundations (For the Curious)
The tool is built on solid statistical foundations:
Probability Distributions:
PERT distributions for threat frequency (reflects expert judgment with mode-focused distributions)
Lognormal distributions for loss magnitudes (models real-world financial losses, which are right-skewed)
Poisson sampling for actual event occurrence (accounts for random variation in event timing)
Simulation Engine:
Uses NumPy's high-performance random number generation
Validates against NIST statistical test suites
Produces reproducible results with optional random seeds
Visualization:
Interactive Plotly charts (zoom, hover, pan capabilities)
Four key views: distribution, exceedance curve, percentiles, and LEF analysis
Export-ready for inclusion in reports and presentations
Data Quality: All preset scenarios are calibrated using:
Verizon DBIR 2024/2025 data
ENISA Threat Landscape 2024
Cyentia Institute IRIS reports
EU GDPR enforcement tracker
Coalition/Allianz cyber insurance claims data
This isn't guesswork dressed up as science — it's statistically sound analysis grounded in real-world data.
Getting Started
Download the command-line tool here: (https://github.com/paolocarner/fair-monte-carlo-risk-analysis)
The tool is designed to be accessible whether you're a Python expert or someone who's never coded before.
The Python scripts are fully documented, modular, and extensible. Integrate them into your existing workflows, modify distributions, or automate batch analyses across your entire client portfolio.
Documentation Included:
Comprehensive methodology guide (70+ pages covering FAIR fundamentals)
Industry parameter reference with benchmarked values for common scenarios
Quick-start tutorials for both dashboard and scripts
Client scenario templates ready to customize
I've also included extra documentation that should get you started on:
How to estimate parameters when you lack historical data
Industry-specific modifiers for different sectors (healthcare, financial services, etc.)
Control effectiveness metrics (how much does MFA reduce risk? What about EDR?)
How to present results to different audiences (boards vs. technical teams).
The Bigger Picture: Moving Beyond Fear-Based Selling
Here's something that frustrates me about our industry: too many cybersecurity vendors rely on fear, uncertainty, and doubt (FUD) to sell products. "You're at HIGH RISK!" — but high compared to what? What does that cost us? Is the proposed solution worth the investment?
Quantitative risk analysis changes this dynamic entirely. When you can show a client:
Their current exposure in euros
The probability distribution of potential losses
The expected ROI of the proposed controls
How their risk compares to industry peers
...you're no longer selling fear. You're providing decision support. You're helping them allocate scarce security resources to where they'll have the most impact.
This is the future of our profession: evidence-based, financially grounded, and aligned with business objectives.
What's Next
As I continue to use this tool in my vCISO practice, I'll be sharing:
Real-world case studies showing how different SMEs use quantitative risk analysis
Parameter calibration techniques for when you lack perfect data
Integration guides for connecting FAIR analysis with existing GRC platforms
Advanced techniques like portfolio risk analysis across multiple scenarios
I'm also working on a video tutorial series that walks through complete risk assessments from start to finish, showing exactly how I use the tool during client engagements.
Final Thoughts
When I started this FAIR journey a year ago, I expected to learn about better risk calculation methods. What I didn't expect was how profoundly it would change my client relationships.
Clients no longer see me as the person who tells them things are risky (they already know that). Instead, I'm the person who helps them understand how risky it is, what it costs, and whether mitigation is worth it. That's a fundamentally different — and far more valuable — role.
The interactive Monte Carlo simulation tool is my attempt to share this capability with the broader community. Whether you're a solo consultant, a vCISO managing multiple clients, or an in-house CISO building your risk program, I hope this tool helps you have better conversations about cyber risk.
Because at the end of the day, that's what FAIR is really about: not just better math, but better decisions.
If you want to access the tool and documentation, reach out to me directly through the contact form, and I'll send you everything you need to get started.
Until next time, stay quantitative!
Paolo Carner is the founder of BARE Cybersecurity, providing vCISO services to European SMEs and startups. He specializes in making enterprise-grade cybersecurity practices accessible and affordable for growing businesses.